Since the multi-replica post, Mini Order System has been running replicas: 3. Three pods, all day, every day. At 3 a.m. when nobody is creating orders, three pods. During the fake "marketing campaign" load test I ran last week that pushed the order API to a few thousand requests per second, also three pods — and the p99 latency graph looked like a hockey stick.
That's the problem with a hardcoded replica count: it's wrong in both directions. It wastes resources when traffic is low and falls over when traffic spikes. I was the autoscaler, and I'm a bad one, because I'm asleep for a third of the day.
This post replaces me with a HorizontalPodAutoscaler. By the end, Mini Order System scales itself from 2 pods to 10 and back based on CPU, and I've load-tested it hard enough to watch the whole loop happen live.
What breaks without it
Let me make the failure concrete, because "falls over under spikes" is hand-wavy.
Mini Order System's hot path is order traffic: POST /orders validates an order, writes it to Postgres, and returns a 201 with an order ID; clients then use GET /orders/:id to look up its status. Those requests are relatively lightweight, but they are the paths that take all the traffic. With 3 replicas and my current (admittedly rough) resource requests, each pod comfortably handles a few hundred order requests per second before CPU saturates and latency climbs.
So the math is simple and brutal. If order traffic suddenly quadruples, I have three options:
- Be awake, notice, and run
kubectl scale deployment mini-order-backend --replicas=8by hand. - Permanently run 8+ replicas so the spike never hurts. Now I'm paying for 8 pods to serve traffic that needs 2 most of the day.
- Let the pods saturate. Requests queue, latency blows past a second, and eventually the pods start failing in ways that make everything worse.
I actually watched option 3 happen. During an early load test, CPU on all three pods pinned at the limit, and order request latency went from 8ms to over 900ms. Nothing crashed — that's the insidious part. The service was just quietly terrible.
Kubernetes' answer to this is the HorizontalPodAutoscaler, and it's one of the features that made me feel like the platform was finally paying rent.
The concept: a control loop watching a control loop
An HPA is not magic and it's not machine learning. It's a dumb, honest control loop, which is exactly what you want.
Every 15 seconds (by default), the HPA controller:
- Asks the metrics API for the current CPU usage of every pod behind a target (our
mini-order-backendDeployment). - Averages usage as a percentage of each pod's CPU request.
- Computes the replica count that would bring that average to your target.
- Updates
spec.replicason the Deployment. The Deployment controller does the rest — same machinery as when you scale by hand.
The formula is genuinely this simple:
desiredReplicas = ceil(currentReplicas × currentMetric / targetMetric)
If 2 pods are averaging 140% CPU and your target is 70%, it computes ceil(2 × 140 / 70) = 4 and sets replicas to 4. That's the whole trick. An HPA is a control loop that adjusts the input to another control loop (the Deployment). Once you see Kubernetes as layers of reconciliation loops, the HPA fits right in.
Two things took me a while to internalize:
The percentage is relative to the request, not the limit or the node. This tripped me up for an entire evening. "70% CPU" means 70% of resources.requests.cpu. Our mini-order-backend pods request 100m, so 70% = 70 millicores of actual usage. If you haven't set a CPU request, the HPA has no denominator and just reports <unknown> and does nothing. We set rough requests back when we first deployed, which is the only reason this post works; the next post tunes them with real data, because my current numbers are guesses.
The metrics have to come from somewhere. The HPA controller reads from the metrics.k8s.io API, which is served by metrics-server — a component that scrapes CPU/memory from every kubelet. Here's a place k3d quietly did me a favor: k3s bundles metrics-server out of the box. On kind or minikube you have to install it yourself (and on kind, fight it about TLS flags). Verify it's alive:
kubectl top pods
NAME                         CPU(cores)   MEMORY(bytes)
postgres-7d4b8c9f4-x8kkq     4m           38Mi
mini-order-backend-6f7d9b5c8-2nfhl    2m           41Mi
mini-order-backend-6f7d9b5c8-9wzqt    3m           40Mi
mini-order-backend-6f7d9b5c8-kd4rp    2m           42Mi
If kubectl top pods works, the HPA will too.
Implementing it
Here's the HPA, using autoscaling/v2 — not v1, which only does CPU and has a clunkier shape. v2 has been stable since 1.23; there's no reason to write anything else.
# k8s/mini-order-backend-hpa.yaml
apiVersion: autoscaling/v2
kind: HorizontalPodAutoscaler
metadata:
  name: mini-order-backend
spec:
  scaleTargetRef:
    apiVersion: apps/v1
    kind: Deployment
    name: mini-order-backend
  minReplicas: 2
  maxReplicas: 10
  metrics:
    - type: Resource
      resource:
        name: cpu
        target:
          type: Utilization
          averageUtilization: 70
Reactions, because a couple of these lines cost me time:
scaleTargetRefpoints at the Deployment, not the pods or the Service. The HPA edits the Deployment's replica count; it never touches pods directly.minReplicas: 2, not 1. I want to keep the "a pod can die and nobody notices" property from the multi-replica post even at the quietest hour. Autoscaling to 1 replica means autoscaling back into single-point-of-failure territory.averageUtilization: 70is a target the controller steers toward, not a threshold it reacts at. This distinction confused me at first. It's not "scale up when CPU crosses 70%" — it's "continuously pick the replica count that would make average CPU equal 70%." A thermostat, not an alarm.
One thing to delete before applying: the replicas: 3 line in the Deployment YAML. If you leave it there and re-apply the Deployment later, you'll stomp whatever the HPA decided and they'll briefly fight. Remove the field entirely and let the HPA own it.
Apply it, then check what the HPA sees:
kubectl apply -f k8s/mini-order-backend-hpa.yaml
kubectl get hpa
NAME        REFERENCE              TARGETS       MINPODS   MAXPODS   REPLICAS
mini-order-backend   Deployment/mini-order-backend   cpu: 2%/70%   2         10        3
2%/70% — the metrics pipeline works. A minute later it scaled down to 2, because 3 idle pods are more than a 70% target needs. First autonomous decision. Small, but I grinned.
If you see <unknown>/70% instead: your pods are missing CPU requests, or metrics-server isn't running. Those are the only two causes I've hit.
Wiring it to the app: nothing, and that's the point
Mini Order System's code doesn't change at all this post, and it's worth pausing on why. Back in the multi-replica post, scaling broke our in-memory order-state cache and forced us to make the app properly stateless — every pod identical, all state in Postgres. That pain is what's paying off now. The HPA can add and remove pods freely because no pod is special.
If your app hoards state in memory, an autoscaler doesn't fix that — it automates the breakage.
Load testing: watching it actually scale
hey was fine for quick pokes, but I wanted a sustained, shaped load, so this is where I switched to k6.
One honest wrinkle first: we don't have an Ingress yet (that's two posts away), and load testing through kubectl port-forward is lying to yourself — you're funneling everything through one TCP tunnel on your laptop and mostly benchmarking the tunnel. So I ran k6 inside the cluster, pointed straight at the Service DNS name. That also happens to test the Service load-balancing path exactly the way real in-cluster traffic flows.
A word on how k6 models load, since the script leans on it: a virtual user (VU) is one simulated client running your default function in a loop as fast as it can, so N VUs means N concurrent request loops; stages ramp the number of active VUs up and down over time, so target: 200 over three minutes means "climb to 200 concurrent loopers and hold." That ramp is exactly the shaped spike we want to watch the HPA react to.
The script, mounted via ConfigMap:
// k6/orders-load.js
import http from "k6/http";
import { check } from "k6";

export const options = {
  stages: [
    { duration: "1m", target: 50 },   // ramp up to 50 virtual users
    { duration: "3m", target: 200 },  // sustained spike
    { duration: "1m", target: 0 },    // ramp down
  ],
};

export default function () {
  const create = http.post(
    "http://mini-order-backend.default.svc.cluster.local:8000/orders",
    JSON.stringify({
      customerId: "customer-42",
      items: [{ sku: "coffee-beans", quantity: 2 }],
    }),
    { headers: { "Content-Type": "application/json" } },
  );
  check(create, { "created order": (r) => r.status === 201 });

  const orderId = create.json("id");
  const status = http.get(
    `http://mini-order-backend.default.svc.cluster.local:8000/orders/${orderId}`,
  );
  check(status, {
    "looked up order": (r) => r.status === 200,
    "order has status": (r) => Boolean(r.json("status")),
  });
}
The two-step flow matters: creating an order exercises the write path and the status lookup exercises the read path, so the test represents what an order client actually does.
First load the script into a ConfigMap so the pod can mount it, then run k6. Mounting a ConfigMap is exactly the thing kubectl run can't express cleanly on the command line, so I stopped fighting it and wrote a small Job — the right primitive anyway, since a load test is a run-to-completion task, not a service:
kubectl create configmap k6-script --from-file=k6/orders-load.js
# k6/load-job.yaml — a throwaway load-test Job
apiVersion: batch/v1
kind: Job
metadata:
  name: k6-load
spec:
  backoffLimit: 0            # a failed load test shouldn't retry itself
  template:
    spec:
      restartPolicy: Never
      containers:
        - name: k6
          image: grafana/k6
          args: ["run", "/scripts/orders-load.js"]
          volumeMounts:
            - name: script
              mountPath: /scripts
      volumes:
        - name: script
          configMap:
            name: k6-script
kubectl apply -f k6/load-job.yaml
kubectl logs -f job/k6-load     # follow the k6 output live
Same three moving parts as the unreadable one-liner it replaces — image, the script mounted at /scripts, the run args — just legible, re-runnable, and greppable. When the test's done, kubectl delete job k6-load clears it out.
In a second terminal, the main event:
kubectl get hpa backend-hpa -n mini-order --watch
NAME        REFERENCE              TARGETS        MINPODS  MAXPODS  REPLICAS
mini-order-backend   Deployment/mini-order-backend   cpu: 3%/70%    2        10       2
mini-order-backend   Deployment/mini-order-backend   cpu: 61%/70%   2        10       2
mini-order-backend   Deployment/mini-order-backend   cpu: 158%/70%  2        10       2
mini-order-backend   Deployment/mini-order-backend   cpu: 158%/70%  2        10       5
mini-order-backend   Deployment/mini-order-backend   cpu: 96%/70%   2        10       5
mini-order-backend   Deployment/mini-order-backend   cpu: 74%/70%   2        10       8
mini-order-backend   Deployment/mini-order-backend   cpu: 52%/70%   2        10       8
mini-order-backend   Deployment/mini-order-backend   cpu: 68%/70%   2        10       8
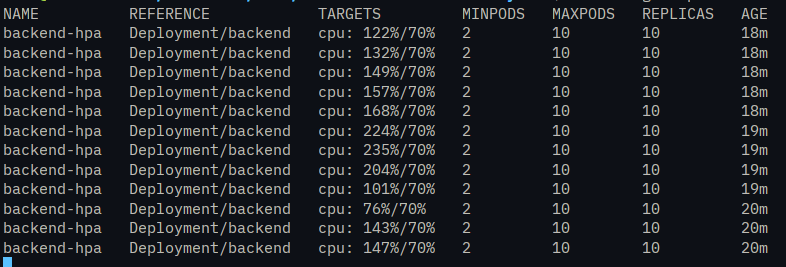
Read that third-to-fourth line again: CPU hit 158% of request, and the controller computed ceil(2 × 158/70) = 5 and jumped straight to 5 replicas. Not one at a time — straight to the count the formula says. Then another correction to 8 as load kept climbing. During the sustained phase it hovered at 8 pods, average CPU orbiting the 70% target. The k6 summary on the other side: p95 order request latency stayed under 25ms through the whole spike. With fixed replicas: 3, the same test had p95 north of 800ms.
Reference implementation issue: distributed-order-system#14.
kubectl describe hpa mini-order-backend shows the decisions as events, which is the first place to look when scaling does something you don't expect:
Events:
  Normal  SuccessfulRescale  New size: 5; reason: cpu resource utilization
          (percentage of request) above target
  Normal  SuccessfulRescale  New size: 8; reason: cpu resource utilization
          (percentage of request) above target
The scale-down surprise
The test ended. Load dropped to zero. CPU fell to 2%. And the replica count sat at 8. And sat. And sat.
I genuinely thought I'd broken something and spent ten minutes re-reading the HPA spec before finding it: scale-down has a default stabilization window of 300 seconds. The controller looks at the highest desired replica count over the last 5 minutes and refuses to go below it. Scale-up is immediate; scale-down is deliberately sluggish.
Almost exactly five minutes after the test ended:
mini-order-backend   Deployment/mini-order-backend   cpu: 2%/70%   2   10   8
mini-order-backend   Deployment/mini-order-backend   cpu: 2%/70%   2   10   2
Once I stopped being annoyed, I realized this is a feature. Real traffic is spiky. Without the window, a 30-second lull would tear pods down just in time for the next wave to arrive and find capacity gone — flapping, and flapping means churn, cold starts, and worse latency than just keeping the pods around. The asymmetry is the right default: panic up fast, calm down slowly.
You can tune it with the behavior block if the default doesn't fit. It goes in k8s/mini-order-backend-hpa.yaml, nested directly under spec: alongside metrics:
# k8s/mini-order-backend-hpa.yaml — add under spec:
  behavior:
    scaleDown:
      stabilizationWindowSeconds: 120
      policies:
        - type: Pods
          value: 2
          periodSeconds: 60
That says: only consider the last 2 minutes, and never remove more than 2 pods per minute. I've left Mini Order System on the defaults — I don't have evidence they're wrong yet, and tuning without evidence is how you build config nobody can explain later.
Breaking it on purpose
To make sure I actually understood the formula, I set averageUtilization: 10 and re-applied. Even Mini Order System's idle CPU (health checks, connection keepalives — a few millicores) is enough to exceed 10% of a 100m request under any real traffic. I sent a trickle of requests with hey and watched the HPA slam straight to maxReplicas: 10 and pin there, with events complaining it wanted even more:
Warning  FailedComputeMetricsReplicas  ...
Normal   SuccessfulRescale  New size: 10; reason: cpu resource utilization above target
Message: Deployment pods are at max replicas
Useful lesson in the failure mode: an over-aggressive target doesn't oscillate, it saturates. You pay for max replicas around the clock and the HPA might as well not exist. It also demonstrated that maxReplicas is doing real work as a blast-radius cap — without it, a bad target or a metrics glitch could try to scale into whatever the cluster would give it.
Reverted to 70%, five minutes later everything drained back to 2. The loop just... handles it.
What still doesn't work
Honesty section, and this one has teeth.
CPU is a crude proxy for what Mini Order System actually cares about. Mini Order System is an order-processing API; its real health metric is request latency and throughput, not CPU. They correlate — that's why this post works at all — but they're not the same. A pod stuck on slow Postgres queries has terrible latency and low CPU; the HPA would happily scale down mid-incident. The grown-up answer is scaling on RPS or latency via custom metrics — Prometheus adapter or KEDA — and that's the real-world path for latency-bound services. I'm not covering it until we have Prometheus in the picture at all, which we don't yet.
Postgres does not autoscale, and nothing here helps it. This is the mismatch I keep bumping into: I kept half-expecting the database to behave like the app tier, and it just doesn't. Every new mini-order-backend pod opens its own connection pool, so scaling 2→10 quintupled the connection count Postgres has to hold. At 10 pods I'm fine; at 50 I'd be staring at FATAL: sorry, too many clients already. Scaling the stateless tier moves load onto the stateful tier. The HPA made Mini Order System's easiest scaling problem automatic and left the hard one exactly where it was.
My resource requests are still guesses. The entire HPA math divides by requests.cpu, and I picked 100m by vibes back in post 04. If the request is wrong, every percentage the HPA computes is wrong with it. And limits are their own minefield — a bad memory limit doesn't degrade politely, it gets your pod OOMKilled, and bad CPU limits throttle you invisibly. That's exactly the next post: putting real numbers behind requests and limits, with load-test data instead of vibes, and breaking things with limits that are deliberately too low.
Next up
Resource requests and limits: what the scheduler actually does with them, watching an OOMKill happen in real time (exit code 137 and everything), CPU throttling you can't see without looking for it, and replacing my guessed numbers with measured ones. The HPA runs on top of those numbers, so it's time they stopped being fiction.